So I just finished my final week of classes. It's been a wild ride these last 12 weeks, and it's kind of a bittersweet feeling. I'm glad that the work is done, but I'm also sad that I won't see people until February after our praticum. I've definitely learned a lot in this class. I've met lots of great people, and found lots of fun activities that I'd love to use in my classroom. Unfortunately, I am in a Core French classroom, so I won't be teaching math. It kind of feels like a waste, since I spent 12 weeks learning about how to teach J/I math, and now I don't even get to use my knowledge. Maybe in my next practicum I will be teaching math, so hopefully I retain this information. At least I have this blog to refer back to to look at some of the strategies and activities to use in the classroom.
Thursday, December 3, 2015

Wednesday, November 25, 2015
Week 11 Reflection
This week we looked at quite a few online resources instead of the text book. This is because the focus was on using technology to teach math in the classroom. I think that this is a really useful topic, since we are being taught to use technology in most of our classes to make lessons fun for our students. A lot of our activities and resources in this class have been apps and videos to use in our classroom, but this week we went into a bit more depth about the resources we can use.
For one, we can use spreadsheet applications, which are interactive computer programs that allow information to be organized, analyzed, and displayed in the form of a table. I think that any interactive method is a good method, because it allows for differentiated instruction, and also tends to make learning more fun for students. Graphing scientific calculators can also be used, which is what I used when I was in school. I thought those were fun to use, but that was years ago, so I'm not sure in students nowadays would enjoy using them. We did a graphing activity, which was a graphing story about swinging. Graphing stories are short video stories that help students learn to graph on a plane. I like this activity, because it puts the problem into a visual, real-life context. For this particular problem, we had to find the height of the swinger's waist over 12 seconds. Watch the video below to see the problem and solutions:
Then we looked at another good program to use online, Desmos Graphing Calculator. We graphed equations like y = (x-2)^2 and played around with the graphing system. We changed the equation and talked about the transformations. This is a good resource to show examples to students, to explain graphing, and also a good manipulative for students to use themselves.
One activity that I really enjoyed was Prodigy Math Battle. Prodigy is an online game for students, where they are in a virtual world and they can battle opponents to win. However, to win the battles they must answer math questions correctly. What a fun and educational tool! Teachers can have their students log in and answer questions related to their unit that they are instructing. They have to go on the website, find the curriculum strand that they want and the specific topic. There are pre-loaded questions where you can select the test items that you want students to practise. This way teacher can create fun assignments that don't seem like homework. From there, the teachers can see their students' results and see where they need help.
We went over how to do this with the whole class, because it is such a good task!
As a class we decided to see the demonstration of how to create a math battle for our own classroom. We chose probability for grade 8, with the specific topic of complementary events. Then, we went through the questions a as a class to see how to use this website.
We also went over assessment of math assignments and tests/quizzes. This was extremely helpful, because in this class we have been focusing on how to teach math to students, but we have not yet talked about how to assess students' learning. Personally, I don't want to be a teacher who gives pop quizzes and tests every week. I want my students to actually enjoy learning, and want to come to class. I don't want to focus on grades, but on improving my students learning, and making math enjoyable for them. One of the resources I looked at before class was an audio file on Assessment strategies.
Another fun activity we tried in class was the finger counting challenge. The video below explains what this is. I like challenges like these because they require students to think about the solution and not just fill in numbers into a formula. Some student solutions can be found at this site.
Finally, we looked at another math challenge: Zombie Bridge Crossing
The video below describes the problem, and reveals the answer if you want to look at it. If not, I can briefly explain it, because I think it's an interesting problem to solve, and allows the students to use critical thinking.
For one, we can use spreadsheet applications, which are interactive computer programs that allow information to be organized, analyzed, and displayed in the form of a table. I think that any interactive method is a good method, because it allows for differentiated instruction, and also tends to make learning more fun for students. Graphing scientific calculators can also be used, which is what I used when I was in school. I thought those were fun to use, but that was years ago, so I'm not sure in students nowadays would enjoy using them. We did a graphing activity, which was a graphing story about swinging. Graphing stories are short video stories that help students learn to graph on a plane. I like this activity, because it puts the problem into a visual, real-life context. For this particular problem, we had to find the height of the swinger's waist over 12 seconds. Watch the video below to see the problem and solutions:
Then we looked at another good program to use online, Desmos Graphing Calculator. We graphed equations like y = (x-2)^2 and played around with the graphing system. We changed the equation and talked about the transformations. This is a good resource to show examples to students, to explain graphing, and also a good manipulative for students to use themselves.
One activity that I really enjoyed was Prodigy Math Battle. Prodigy is an online game for students, where they are in a virtual world and they can battle opponents to win. However, to win the battles they must answer math questions correctly. What a fun and educational tool! Teachers can have their students log in and answer questions related to their unit that they are instructing. They have to go on the website, find the curriculum strand that they want and the specific topic. There are pre-loaded questions where you can select the test items that you want students to practise. This way teacher can create fun assignments that don't seem like homework. From there, the teachers can see their students' results and see where they need help.
 |
| Woolley, E. © 2015 |
As a class we decided to see the demonstration of how to create a math battle for our own classroom. We chose probability for grade 8, with the specific topic of complementary events. Then, we went through the questions a as a class to see how to use this website.
 |
| Woolley, E. © 2015 |
Another fun activity we tried in class was the finger counting challenge. The video below explains what this is. I like challenges like these because they require students to think about the solution and not just fill in numbers into a formula. Some student solutions can be found at this site.
Finally, we looked at another math challenge: Zombie Bridge Crossing
The video below describes the problem, and reveals the answer if you want to look at it. If not, I can briefly explain it, because I think it's an interesting problem to solve, and allows the students to use critical thinking.
Thursday, November 19, 2015
Week 10 Reflection
We're nearing the end of the course. You can tell, because stress levels are high, as is the work load. However, I still manage to find time to write reflections of my math adventures. We focused on chapters 19, 20, and 21 from our textbook this week, which is a lot of reading. We mainly focused on data management and probability in our class. This is actually one of my favourite topics in math, which is really saying something, since (as I'm sure I've mentioned before) I do not really like math.
Probability is almost always a hands on unit, using many fun manipulatives to model chance and probability. I think that this would be my favourite unit to teach, even if it is one of the hardest concepts to understand. Students need to understand the concept of odds, certain to, likely to, equal chance, not likely, and never. The least possible value of a probability is 0, which indicates that the event could never occur; the greatest is 1, which indicates that the event must always occur. If students do not understand value or fractions, they may not grasp this concept, so i must be sure that they understand this first.
Theoretical probability can be confusing, because as the title suggests, it is based on theory. It is probability based on reasoning, written as a ratio of the number of favourable outcomes to the number of possible outcomes. To make it easier to see the possible outcomes, it is a good idea to model out all outcomes. You can use tree diagrams, which gives more details and maps out the probability of outcomes, or area models, which I find to be more confusing and harder to read. You can also graph out the possible outcomes, to find the chances or the outcomes like we did with our prof. He challenged us to pick a die to roll against his and see how many times we could roll a higher number. He had already calculated which particular die would have the highest outcome, so naturally we lost, because we just chose a die randomly. I think this was a good lesson because it proved that the theoretical probability matched the actual outcomes.
We had a lot of fun activities this week, lots that I would use in my own classroom. Some were simple, and others were a bit more complex, but still lots of fun. For one, we had a spinner with numbers 1-4. We spun 10 times and calculated the outcomes based on our spins:
Another activity involved cards, as many probability activities do. Out of a standard deck of 52 cards, we had to write out the odds of various cards. For example, what are the odds of pulling a red card (26/52). We also did the same for a spinner and for rolling a die.
We got to create our own survey and collect data. I think this is a great activity for students to use their own ideas to collect data. My group chose "how do you get to school" and used a pictograph to collect information. We asked our peers to select their answer and use a picture to response. An awesome, hands on activity for students!
Finally, we played a horse racing game, which was a lot of fun. We rolled two die and recorded the number rolled on the graph below. We rolled 52 times before we found the winner, which was #5. It was fun to see how chances worked. We had predicted that 7 would win because there are more variants of 7, but as chance and probability prove, the theoretical outcomes are not always what happens in practise. This was a fun way to play with students and show them theory vs. practise, and also a good way to teach students not to gamble!
Probability is almost always a hands on unit, using many fun manipulatives to model chance and probability. I think that this would be my favourite unit to teach, even if it is one of the hardest concepts to understand. Students need to understand the concept of odds, certain to, likely to, equal chance, not likely, and never. The least possible value of a probability is 0, which indicates that the event could never occur; the greatest is 1, which indicates that the event must always occur. If students do not understand value or fractions, they may not grasp this concept, so i must be sure that they understand this first.
Theoretical probability can be confusing, because as the title suggests, it is based on theory. It is probability based on reasoning, written as a ratio of the number of favourable outcomes to the number of possible outcomes. To make it easier to see the possible outcomes, it is a good idea to model out all outcomes. You can use tree diagrams, which gives more details and maps out the probability of outcomes, or area models, which I find to be more confusing and harder to read. You can also graph out the possible outcomes, to find the chances or the outcomes like we did with our prof. He challenged us to pick a die to roll against his and see how many times we could roll a higher number. He had already calculated which particular die would have the highest outcome, so naturally we lost, because we just chose a die randomly. I think this was a good lesson because it proved that the theoretical probability matched the actual outcomes.
We had a lot of fun activities this week, lots that I would use in my own classroom. Some were simple, and others were a bit more complex, but still lots of fun. For one, we had a spinner with numbers 1-4. We spun 10 times and calculated the outcomes based on our spins:
 |
| Woolley, E. © 2015 |
 |
| Woolley, E. © 2015 |

 |
| Woolley, E. © 2015 |

 |
| Woolley, E. © 2015 |

Saturday, November 14, 2015
Week 9 Reflection
This week we discussed Measurement, which was covered in chapters 17 and 18 of the textbook. This was also the week that I got to present my Learning Activity Presentation.
First we talked about time, which I think is a fairly difficult topic to teach. The concept of time as a measurement is hard to understand, so it is a good thing that we reviewed strategies for teaching it. I think that the person who presented this topic did a great job. He made lots of jokes and really captured our attention, which in my opinion is a really good way to engage students. When I become more comfortable with math, I think I will try to incorporate this strategy into my own teaching. I think humour really shows students that you are comfortable being in front of the class and know the material well. It is also comforting for students to hear jokes because it eases the tension and reduces stress that students have with math.
I got to do my presentation, which was kind of nerve-wracking because I'm not the best at math. I think it went fairly well, I don't think I messed up at all. I went over perimeter, and using different manipulatives for measuring length. I think this was a really good experience, because it gave me the opportunity to practice teaching math in front of people. It really got me out of my comfort zone and ready to start teaching math, which I think was a great assignment. I talked about using nonstandard and standard units to measure length and perimeter. I had no idea that there was such thing as nonstandard units, but i think its a really neat concept to teach. It helps students understand the concept of measuring length without attaching it to a standard unit of measurement. Some of my favourite nonstandard and standard units of measurement are pictured below:
I think that I was well prepared and had an interesting activity planned. I didn't get it from the textbook, because there were no activities planned for teaching perimeter. I found it at this site which listed a few hands-on activities for students. Students had to write their name in block letters onto centimetre grid paper, and then measure the perimeter of each letter and full name using nonstandard and standard units. I liked this activity because students got to be creative and also to practice measuring with different manipulatives. Below is my example that I did with my name:
The other two presenters talked about area and volume respectively. They both had good activities that helped to highlight the concepts of area and volume. We went over some more good hands on activities that I hope to use in my classroom. The one I liked was a real-life activity for calculating volume. We got an empty Kraft Dinner box and centimetre blocks. We used these standard units to measure and calculate the volume of the box. I liked this activity because it was visual and hands-on, unlike the worksheets and questions I had to do when I learned volume. This is better because students can actually see how volume works.
We did some more fun activities after the presentations. We read a short story about the Pythagorean Theorem, and did an estimating activity. We had to estimate how far we could jump, and then measure it. It was surprising how much fun we had jumping and competing, so I can only imagine that students would have just as much fun with this activity.

Finally, we watched a funny video featuring John Green, one of my favourite authors, explaining 36 unusual units of measure. It was funny, and educational. I would show this video to my class, have them take notes on their favourite obscure units of measurement, and then measure objects as a fun activity.
First we talked about time, which I think is a fairly difficult topic to teach. The concept of time as a measurement is hard to understand, so it is a good thing that we reviewed strategies for teaching it. I think that the person who presented this topic did a great job. He made lots of jokes and really captured our attention, which in my opinion is a really good way to engage students. When I become more comfortable with math, I think I will try to incorporate this strategy into my own teaching. I think humour really shows students that you are comfortable being in front of the class and know the material well. It is also comforting for students to hear jokes because it eases the tension and reduces stress that students have with math.
I got to do my presentation, which was kind of nerve-wracking because I'm not the best at math. I think it went fairly well, I don't think I messed up at all. I went over perimeter, and using different manipulatives for measuring length. I think this was a really good experience, because it gave me the opportunity to practice teaching math in front of people. It really got me out of my comfort zone and ready to start teaching math, which I think was a great assignment. I talked about using nonstandard and standard units to measure length and perimeter. I had no idea that there was such thing as nonstandard units, but i think its a really neat concept to teach. It helps students understand the concept of measuring length without attaching it to a standard unit of measurement. Some of my favourite nonstandard and standard units of measurement are pictured below:
 |
| Woolley, E. © 2015 Straws, linking blocks, toothpicks, centimetre cubes/ten blocks, string, measuring tape, and a ruler. |
 |
| Woolley, E. © 2015 |
 |
| Woolley, E. © 2015 |

Finally, we watched a funny video featuring John Green, one of my favourite authors, explaining 36 unusual units of measure. It was funny, and educational. I would show this video to my class, have them take notes on their favourite obscure units of measurement, and then measure objects as a fun activity.
Tuesday, November 10, 2015
Week 8 Reflection
One of the things that I found the most interesting regarding 2-D geometric shapes were tangrams. Tangrams are created by dissecting a square into 7 smaller shapes. These 7 shapes can then be used to either recreate the square or a variety of different shapes. Below is an example of a tangram that we worked on in class:
 |
| Woolley, E. © 2015 |
We also talked about 3-D geometric shapes. This was a fun topic because of the manipulatives we got to play with. We talked about the skeleton of 3D shapes and then we used clay and toothpicks to construct these skeletons. I made a cube, a triangle-based prism, and a square-based prism:
 |
| Woolley, E. © 2015 |
This was a great activity for students to get to see all sides of a 3D shape, and be able to count the edges (counting toothpicks) and vertices (count the red clay). I plan to use this activity in my class, because its a good hands on activity. We also discussed geometric nets, which we could build if we had more class time, and face maps (draw out all the faces of a 3-D shapes. i.e. 6 squares for a cube). These two manipulatives are a good way to show students which 2D shapes make up these 3D shapes.
 |
| Woolley, E. © 2015 |
We were shown various apps this week, but the one I like best was called Symmetry artist. I played around with it after class, because it was a lot of fun. The way it works is you draw on one side of the line of symmetry and the app mirrors your drawing to create a symmetric shape. It is a good example of reflective symmetry because it mirrors the shape that you draw as you are drawing it. This app is fun because you can draw anything (as long as it fits on the drawing area) and you can add details like colour. I could use this as an activity for students to draw their own symmetric shapes by adding lots of detail and using their imaginations.
One of the sites that I explored this week explored the properties of shapes. This site would be good for my students to better understand geometry and gives good examples for creating and constructing shapes on an online sketchpad. I would consider using this as a manipulative for my students because it is a fun, interactive activity to get students to create shapes. It is very in depth with the instructions for creating shapes online, but I would definitely go over how to create shapes on this site with my students so they would know what to do.
Finally, we looked at a commercial for an app called Osmo. It is an interactive app for the iPad that also lets children play with physical manipulatives to better their problem-solving skills:
Thursday, October 29, 2015
Week 7 Reflection
This week we looked at Chapter 22 of the textbook, Patterns and Algebra. I was a bit worried before I started doing the readings, because algebra can be rather intimidating. I don't remember if I was particularly 'good' at algebra when I was in school, so I was a bit worried about this topic. We didn't go too into depth about algebra in our peer taught lessons, we focused more on patterns. There are lots of good tips and strategies for teaching algebra in our textbook (Marian Small provides some of the best strategies), so I am not too worried about teaching it if I have to.
Since this weekend is Halloween, the teacher candidates who taught this week decided to associate the holiday with math, to make it fun. I know I definitely enjoyed these Halloween-themed lessons, so I'm sure it would have been a big hit with kids. I will most definitely try to incorporate holiday themed lessons into my own teaching, to try to engage kids and make things more interesting. I think this is a great strategy to use to get kids excited about math. Halloween-themed math was really tasty, and if I enjoyed it, I'm sure kids would have gone ballistic over having candy to use as a manipulative. We learned about patterning and the rules that go along with it, and we got to create our own patterns using candy. I thought this was a really great idea, and I enjoyed the snack! One of the things we looked over was the core of the pattern; you should include at least 3 repetitions so that students can fully identify the core. Below is the pattern I created using M&M's and Hershey's kisses, with my 3 repetitions of the core pattern:
I thought this was a fun and creative idea to use candy as a manipulative. Another worksheet that I thought was awesome (and Halloween-themed) was about finishing the pattern, and identifying the pattern sequence. It used pictures to to show patterns, but also found a way to use number patterns (at the bottom of the worksheet), but still managed to make it fun (numbers inside pictures of pumpkins). I think it was really well put together, and a fun way to get kids to practise using patterns. I'm going to save this resource to use in my own classroom.
One of the algebra resources that I thought was really cool was trying to identify the word problem with the algebraic expression. I think this was a really smart resource because it helps show students that you can apply real-world situations to algebra. It helps show that algebraic expressions are not just numbers and letters that don't make sense, but you can visualize the problem and find the missing variable to find the answer. The students match up the green pieces of paper, one with the word problem and the other with the algebraic expression. Once they match these up, they can use the blue handout to find what the missing variable is, and complete the equation.
Since this weekend is Halloween, the teacher candidates who taught this week decided to associate the holiday with math, to make it fun. I know I definitely enjoyed these Halloween-themed lessons, so I'm sure it would have been a big hit with kids. I will most definitely try to incorporate holiday themed lessons into my own teaching, to try to engage kids and make things more interesting. I think this is a great strategy to use to get kids excited about math. Halloween-themed math was really tasty, and if I enjoyed it, I'm sure kids would have gone ballistic over having candy to use as a manipulative. We learned about patterning and the rules that go along with it, and we got to create our own patterns using candy. I thought this was a really great idea, and I enjoyed the snack! One of the things we looked over was the core of the pattern; you should include at least 3 repetitions so that students can fully identify the core. Below is the pattern I created using M&M's and Hershey's kisses, with my 3 repetitions of the core pattern:
 |
| Woolley, E. © 2015 |
 |
| Woolley, E. © 2015 |
 |
| Woolley, E. © 2015 |
If students get really confused, they can download the free app on their mobile device called photo math, to take a picture of the equation, and it will solve the problem for them, showing the steps on how the problem was solved. I think this is a valuable resource because it shows students the steps they need to follow to solve the problem, and how to solve similar problems. However, if students use this app to solve all their problems without trying to solve it themselves, they won't learn. If I show this app to my students and allow them to use it, I will only let them use it for really tricky problems that they need extra help with.
Saturday, October 24, 2015
Week 6 Reflection
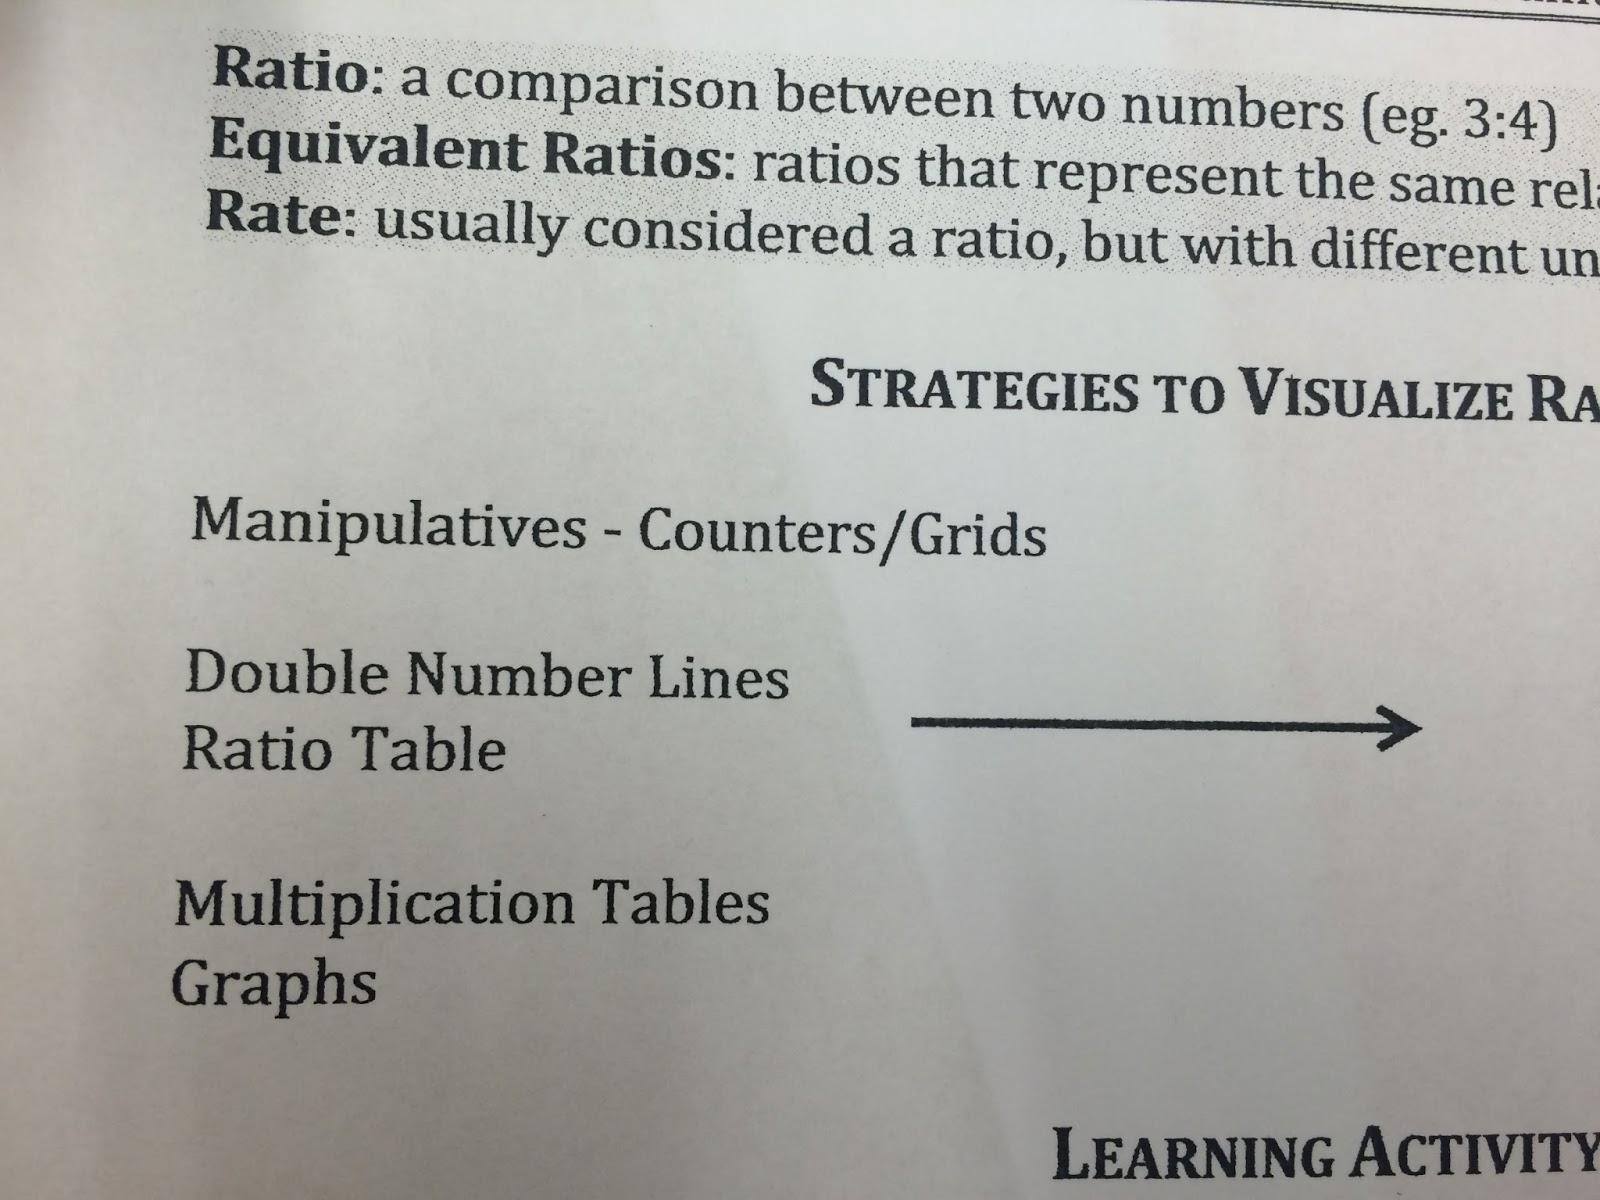
This week you have we read chapter 13 in the textbook which focused on ratio, rate, and percent, but in class we mainly talked about proportional reasoning. We only had one peer present this information to us this week, but it was still quite interesting to learn about. We talked about part-to-part ratios and part-whole ratios in class. This can be a bit of a confusing topic for some students, but with good examples it is can become clearer. We also looked at equivalent rations, which is when two ratios represent the same relationship. For example 3:4 = 6:8. It is much like equivalent fractions, you just have to multiply both numbers by the same number. We went over ratios and rates, and we looked at some good strategies that will help students visualize rate and ratio problems. The handout that we got had this information:
 |
| Woolley, E. © 2015 |
 |
| Woolley, E. © 2015 |
Some of the manipulatives that can be used to solve these problems include:
- counters/grids
- ratio tables/charts - double number lines
- graphs
- multiplication tables - easy to visual equivalent ratios - double it, triple it, etc. and you have your equivalent ratios
We looked at a video that showed students problem solving the Chocolate question
- absolute cost is the same
- goal - get the student differentiate absolute cost and relative proportional cost
- i.e. cost per unit
- 1 chocolate bar 1200g for $10
- 1 chocolate bar 1.3kg for $10
- first convert to same unit - 1200g and 1300g
- both $10 (absolute cost is the same) but one chocolate you get 100g more chocolate for the same price
The students problem solved the problem and shared their thoughts with the class.
It went over what informal proportional reasoning is; one student explained the answer, some students didn't understand so she rephrased her answer to make sure everyone understood the problem and the answer and the reason for her thinking. She provided evidence for her thinking and explained her logic. This video was a good example of how to teaching math to younger students and how to get them engaged.
For the last part of class we talked about the 3-part lesson plan, which is used in most math lessons. We filled in lesson plan template with the model from the video. This way we will be able to understand how to follow the template when we have to write our own lesson plans. Within the 3-part lesson plan there are 7 steps that we have to go through to plan for a math lesson:
- Do the math
- Questions to ask
- Problems to pose
- Instructional strategies
- Resources/materials
- Assessment
- Adaptations/modifications/extensions
We also went over a few examples of success criteria for Sharing Your Work in a math class:
- I can represent my work with a diagram or picture or chart
- I can select a strategy and use operations to show my work
- I can explain the actual steps I took to solve my problem
Overall, this class was very helpful and informative for writing our own lesson plans in math. I will definitely be using this information to help me teach math and plan a lesson plan.
Subscribe to:
Posts (Atom)